

Facoltà di Economia
I Dipartimenti hanno istituito la Facoltà allo scopo di potenziare l'efficacia e l'efficienza delle varie attività e di favorire lo sviluppo culturale, l'integrazione scientifica e l'organizzazione della didattica
La Facoltà di Economia è costituita dai dipartimenti:

Prof. Alberto Iozzi
Direttore

Prof.ssa Martina Conticelli
Direttore
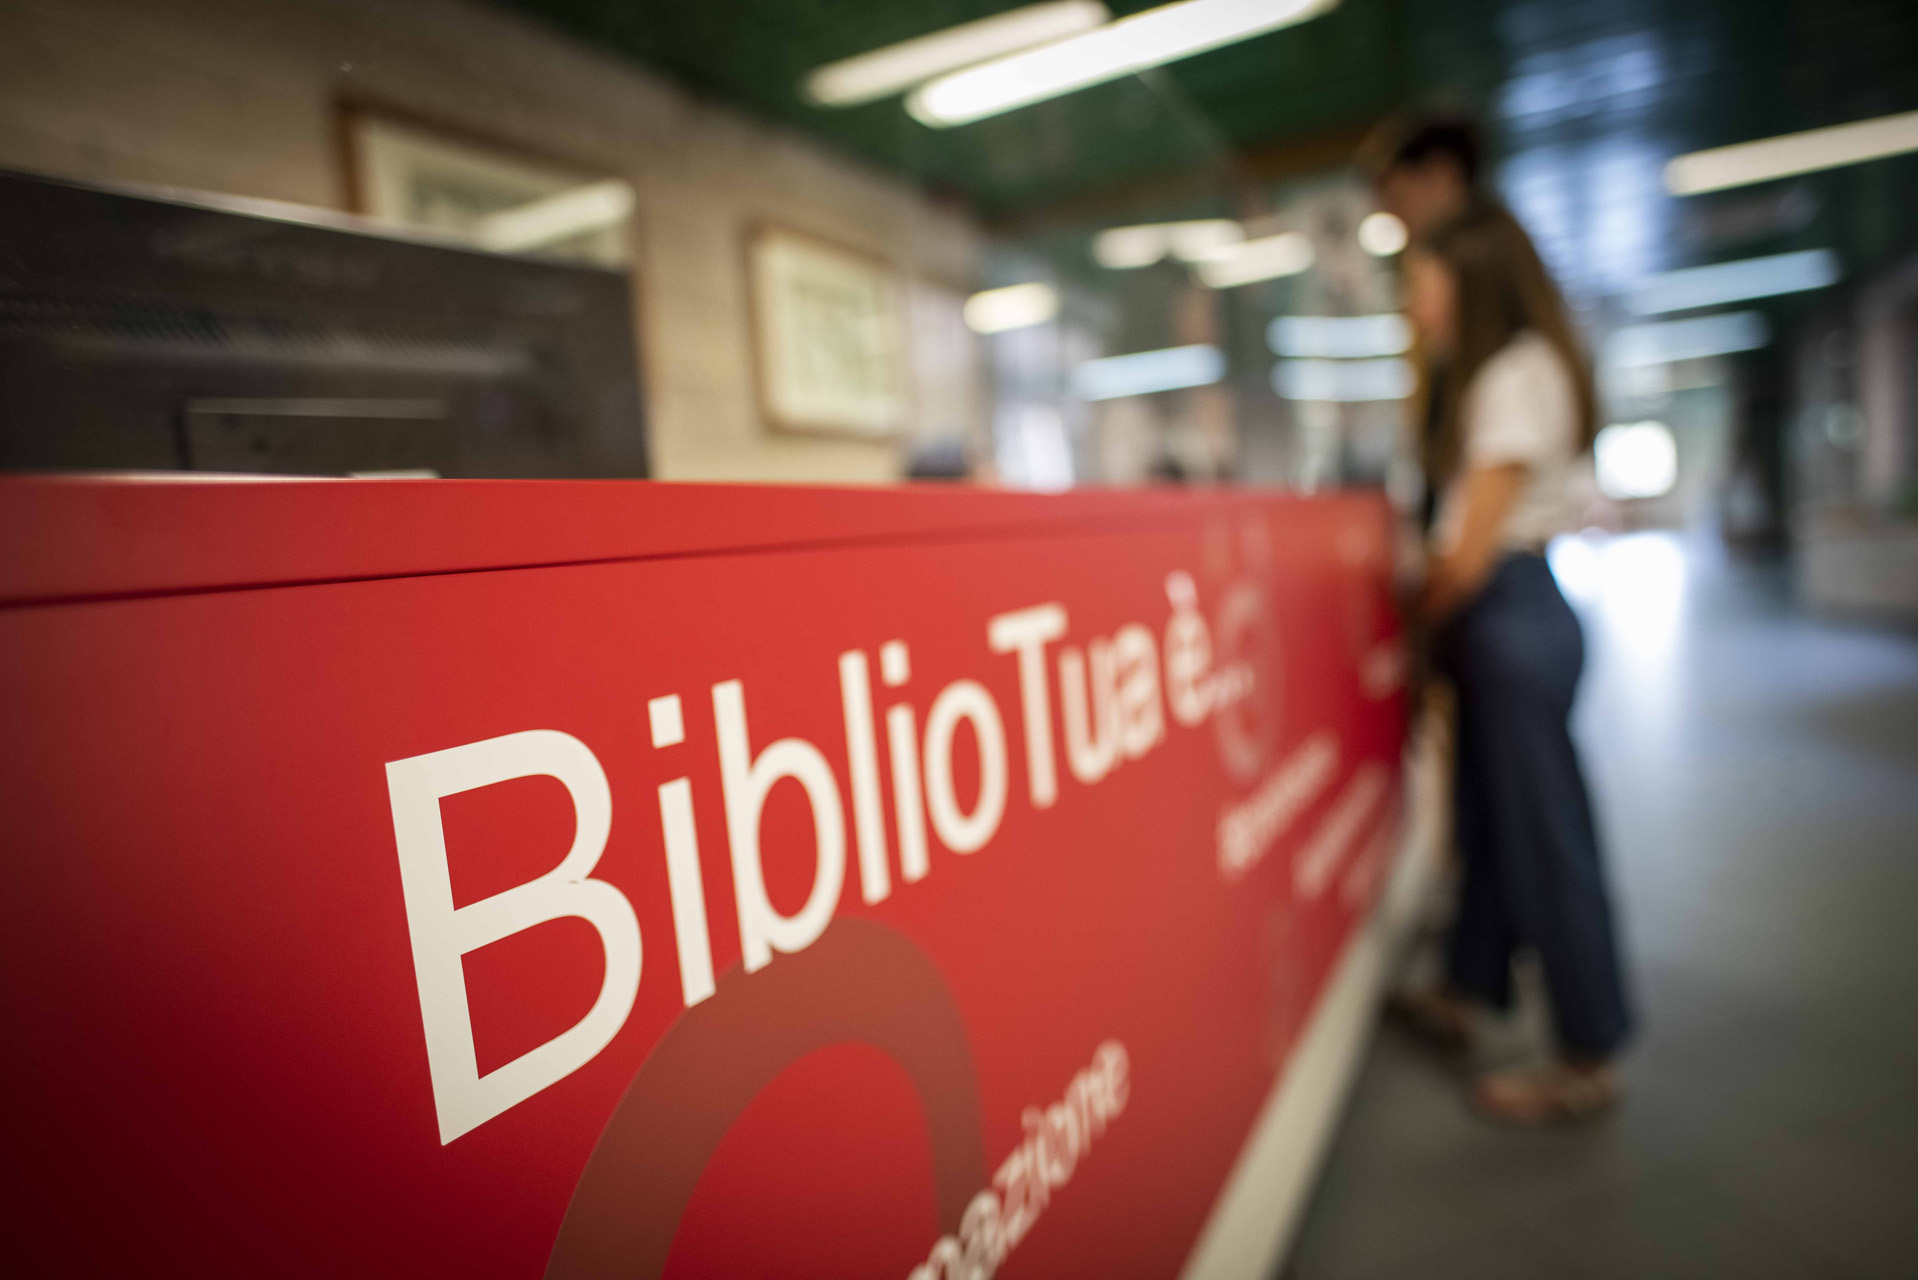
Biblioteca “Vilfredo Pareto”
Servizi bibliotecari, risorse digitali, sale studio e supporto alla ricerca.
Centre for Economic and International Studies
Attività di ricerca, convegni e programmi internazionali.
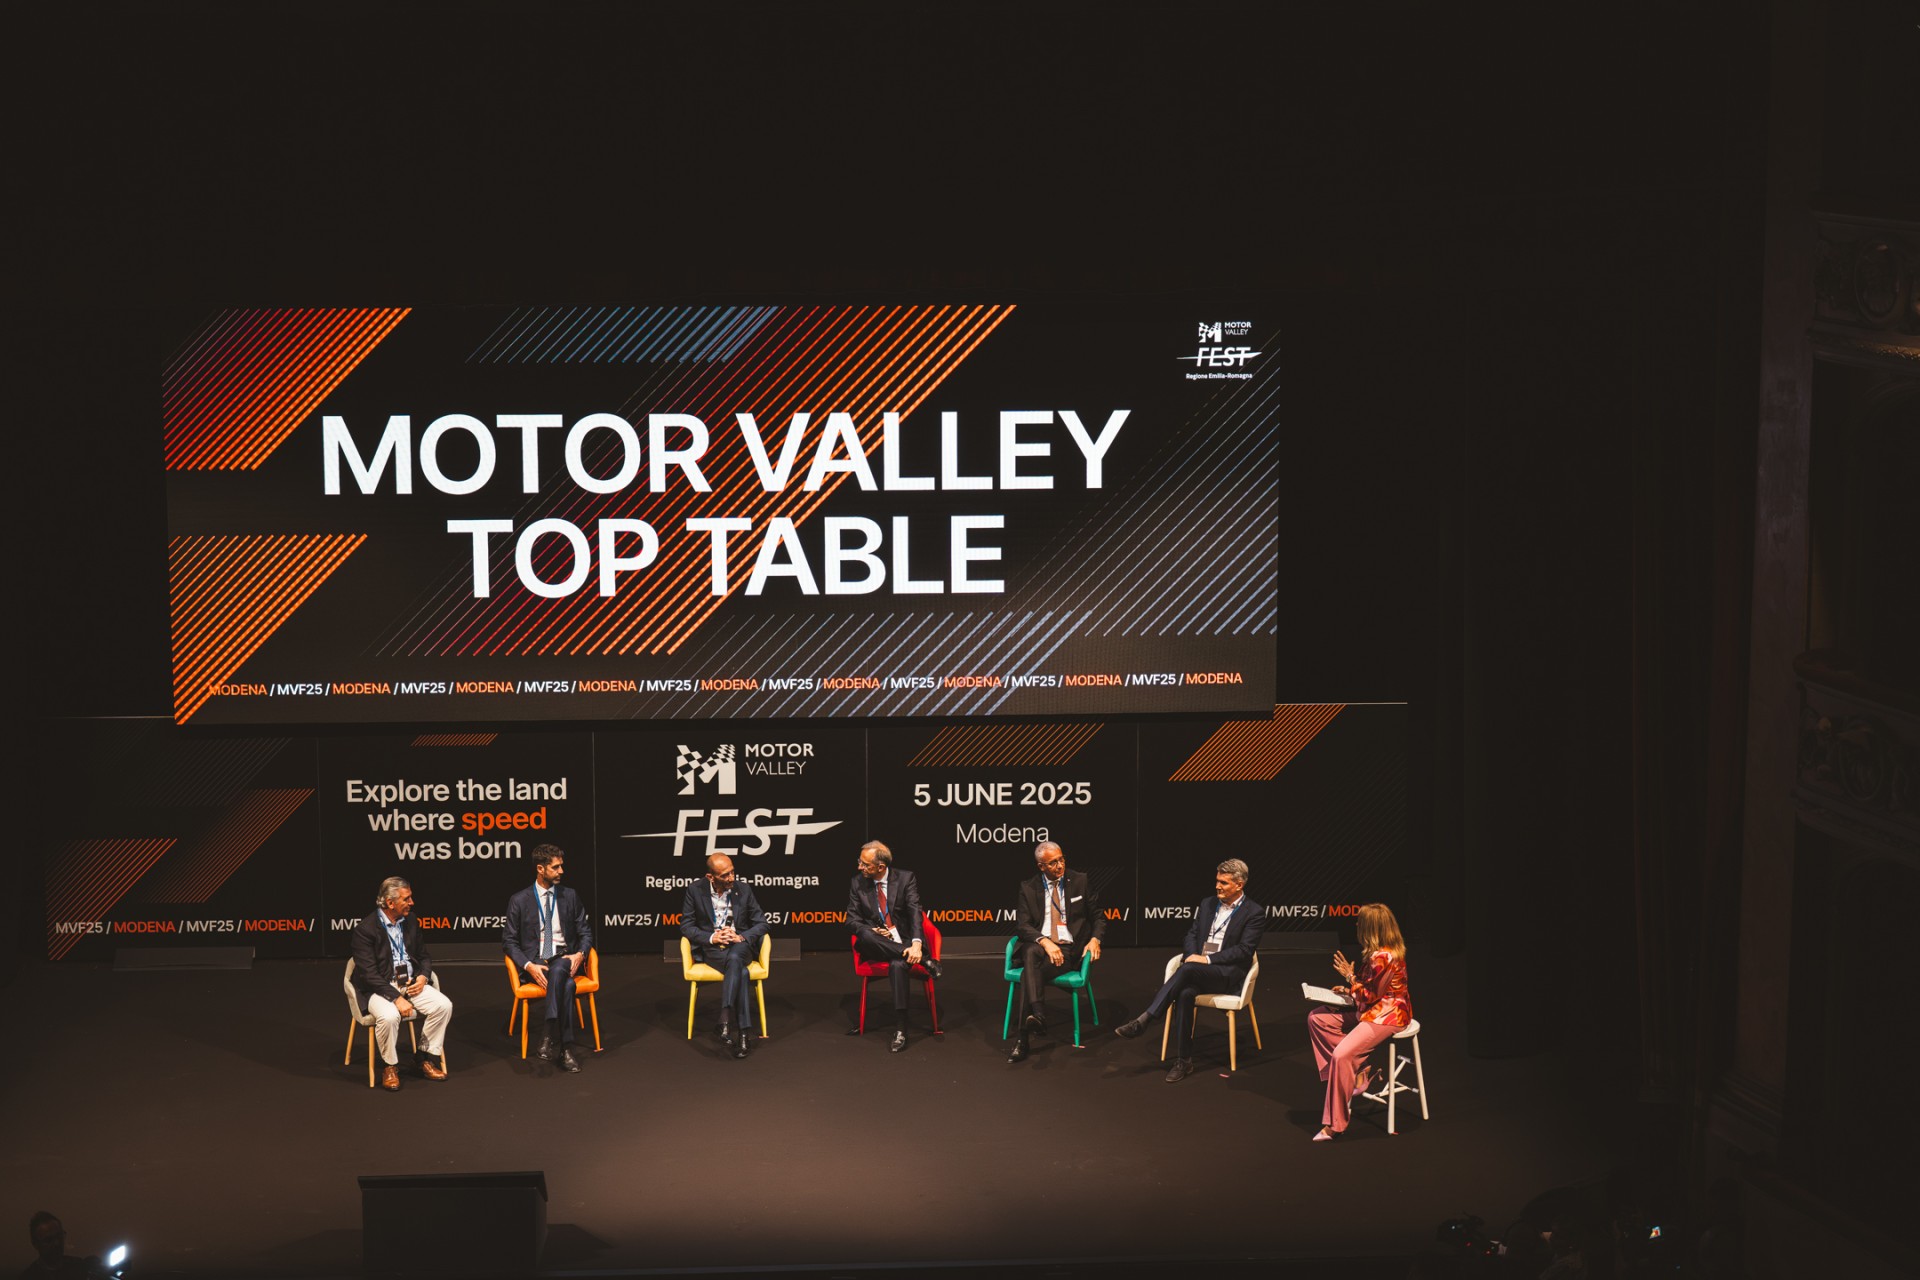
Desk Imprese
Un punto di riferimento per le imprese: collaborazioni, placement e progetti.
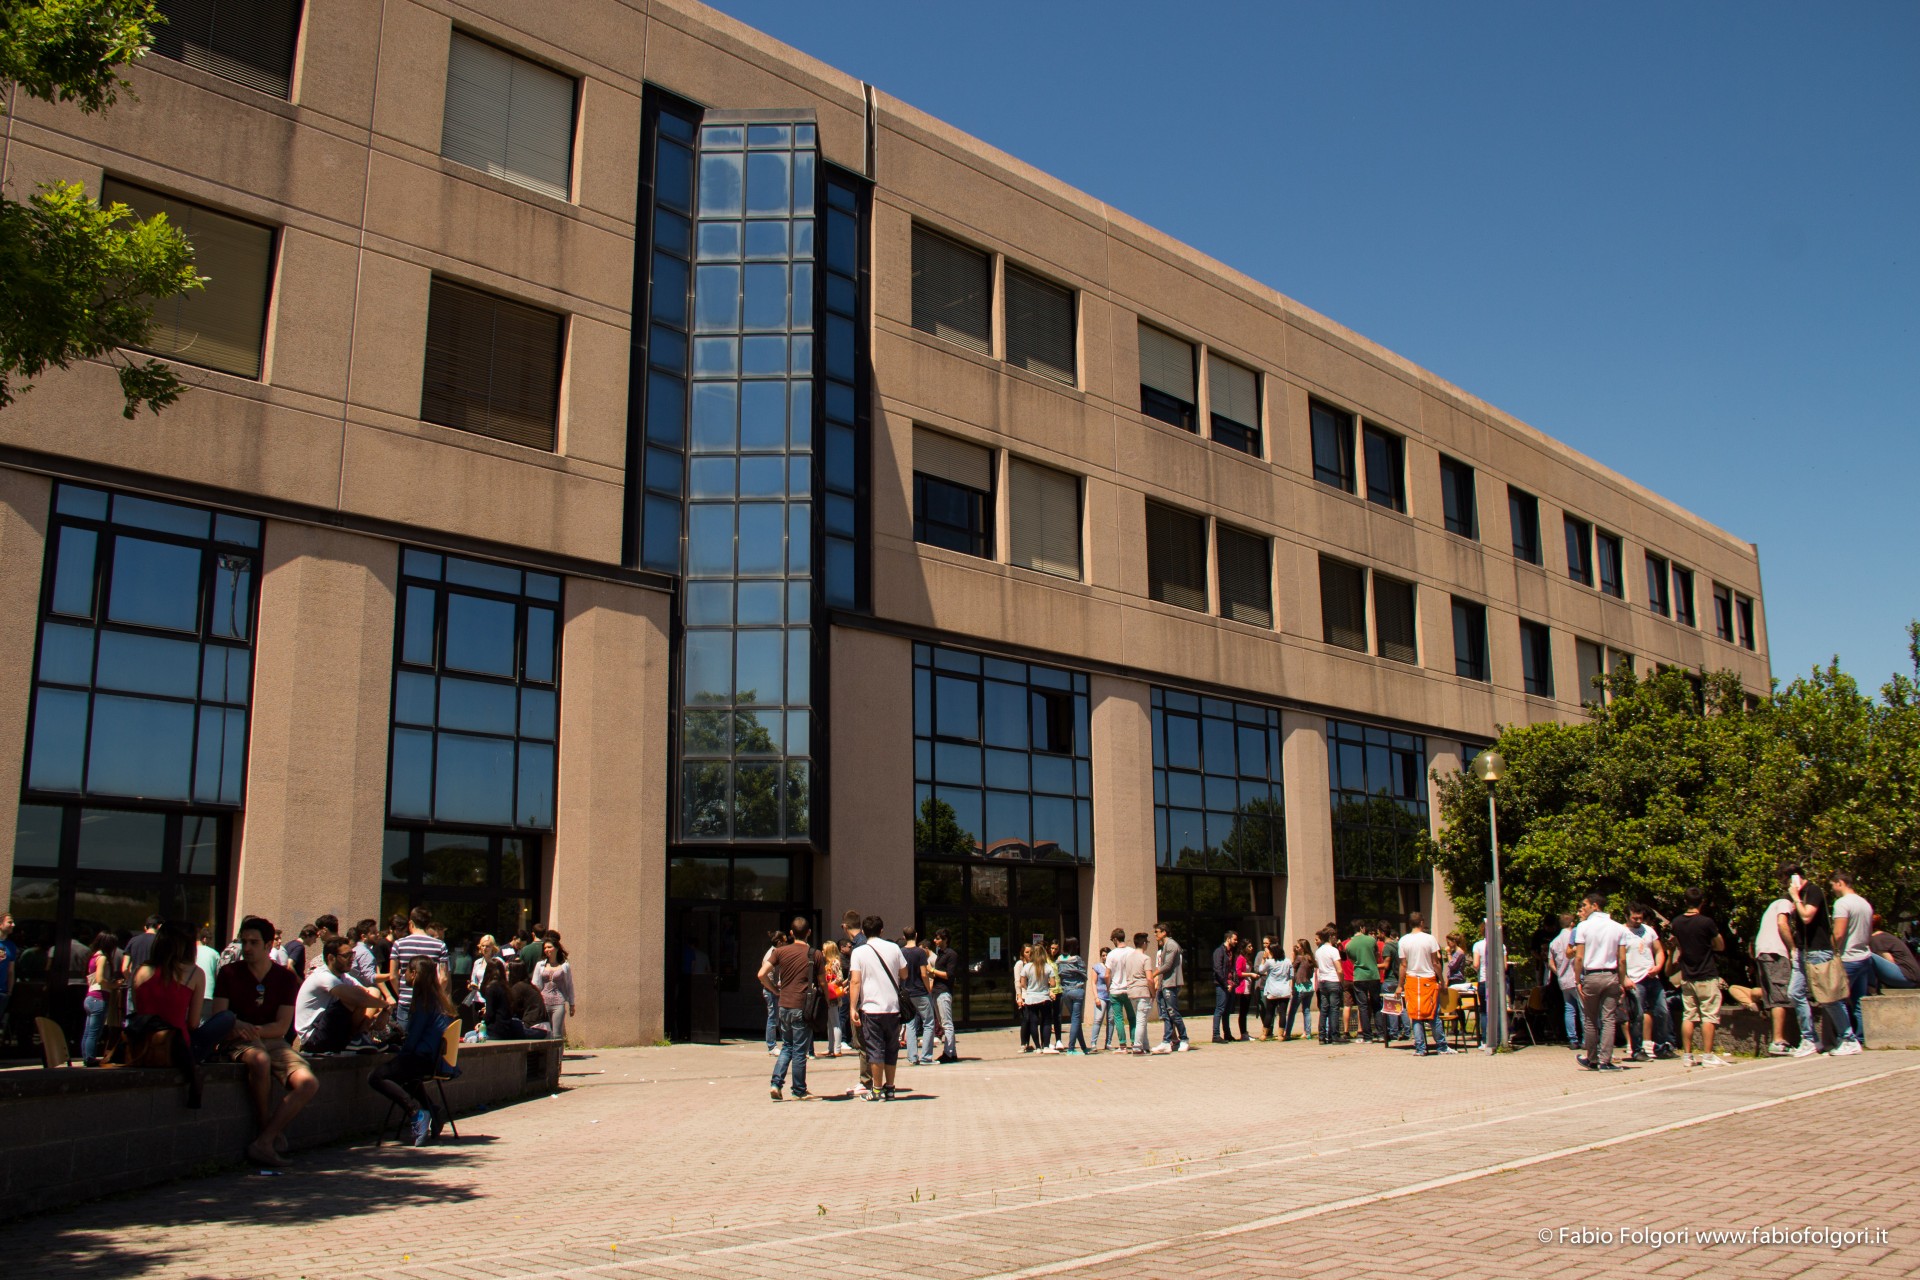
Segreteria Studenti
Informazioni, procedure e servizi per la carriera studentesca.

Segreterie Didattiche
Supporto su piani di studio, esami, tirocini e attività didattiche.
Servizio Elaborazione Dati
Supporto tecnico informatico e multimediale.
Servizi di Ateneo
Servizi centralizzati dell’Università degli Studi di Roma Tor Vergata.



Erasmus+
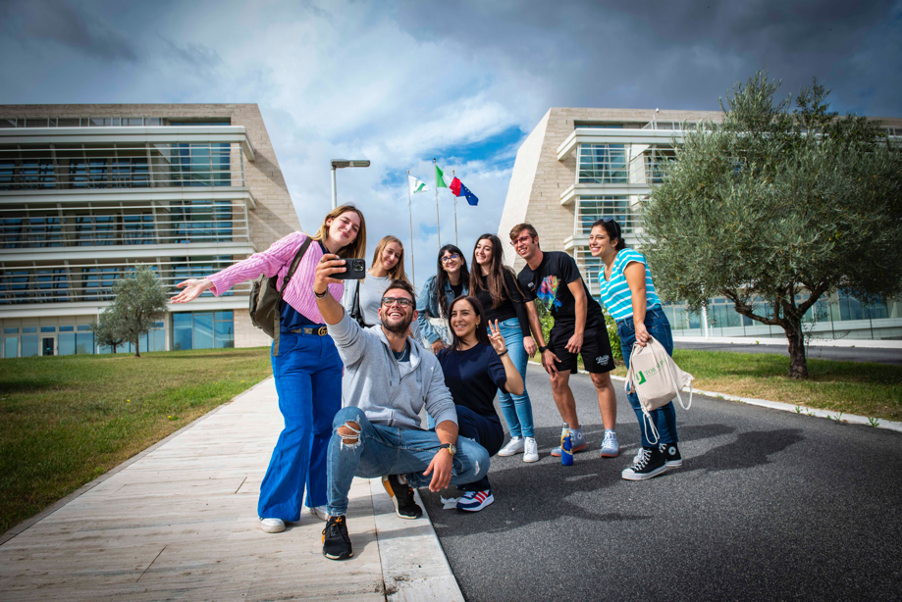
140+ Accordi di mobilità internazionale, studia in una delle nostre università partner europee ed extra-europee.
400+ International students each year. Come in Rome and study with us in a stimulating environment. Become part of our community!
English-Taught Programmes
Explore our English-taught programmes and prepare for a global career in economics, business and finance.
Academic OfferOpportunità
Partners and Institutions
Summer Schools
Tesi e Tirocini all'estero
Centri Linguistici
Corsi e Certificazioni
Corsi e Certificazioni
CLICI - italiano
CLA - lingue straniere
- Dipartimento di Economia e FinanzaTeoria economica | Economia applicata | Econometria | Storia economica | Statistica economica | Matematica finanziaria
- Dipartimento di Management e DirittoEconomia aziendale | Ragioneria | Analisi di bilancio | Management | Marketing | Organizzazione aziendale | Economia degli intermediari finanziari | Diritto privato | Diritto pubblico | Diritto commerciale | Diritto del lavoro | Diritto bancario | Diritto Amministrativo | Diritto Tributario | Pianificazione del territorio | Sviluppo Sostenibile
Centre of Economics and International Studies
Fondato nel 1987 è un Centro di Ricerca in campo economico riconosciuto a livello Internazionale.
Fondato nel 1987 è un Centro di Ricerca in campo economico riconosciuto a livello Internazionale.
Fondazione Tor Vergata
La Fondazione Sostiene e dà impulso al rapporto tra mondo della ricerca, società civile ed istituzioni. Una mission per promuovere l’innovazione e lo sviluppo sostenibile.
La Fondazione Sostiene e dà impulso al rapporto tra mondo della ricerca, società civile ed istituzioni. Una mission per promuovere l’innovazione e lo sviluppo sostenibile.

Public Engagement Economia
Il nostro impegno.

I nostri Progetti
Trasformare conoscenze e competenze in iniziative concrete per la società.

Premi e riconoscimenti
Quando l'impegno genera risultati e valore riconosciuto.

A Economia Spiegata
Capire il presente, condividere il sapere e costruire il futuro.

Ricerca-Azione, FormAzione
Collaborare per innovazione sociale e sviluppo sostenibile.

Non solo Economia
Creare impatto con eventi di sensibilizzazione e coinvolgimento.